The Record

Tax

Brick is the top statutory individual rate — the talking point. Steel is what was actually remitted: IRS total income tax divided by AGI. Same units: percent. The cards pie who paid income tax versus who filed and owed none. Effective is through tax year 2023.

Top rate

statutory ordinary income

37.0%

regular tax, not NIIT

Paid

SOI 2023

14.1%

22.9% below the top

Who paid

of returns filed

69.5%

30.5% owed none

At this year

Donald Trump

2026*

Trump 2 · paid 14.1%

Top ratePaid
010%20%30%40%89939701050913172125

By administration

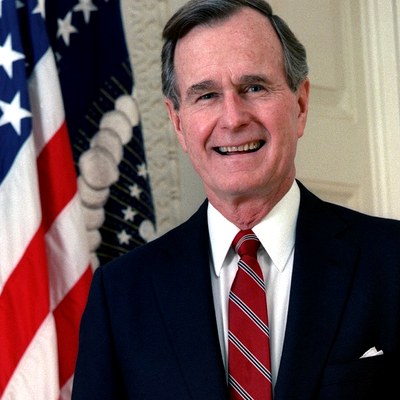
George H. W. Bush

Bush 41

1989–1992

13.6%

Paid tax
78.1%
No income tax
21.9%
Bill Clinton

Clinton

1993–2000

14.8%

Paid tax
75.3%
No income tax
24.7%
George W. Bush

Bush 43

2001–2008

12.8%

Paid tax
67.9%
No income tax
32.1%
Barack Obama

Obama

2009–2016

13.1%

Paid tax
63.3%
No income tax
36.7%
Donald Trump

Trump 1

2017–2020

13.6%

Paid tax
65.4%
No income tax
34.6%
Joe Biden

Biden

2021–2024

14.4%

Paid tax
67.7%
No income tax
32.3%
Donald Trump

Trump 2

2025–2026

14.1%

Paid tax
69.5%
No income tax
30.5%

Post this as a video on X

Portrait video for X. Open the stage, press Replay, or download the MP4.

Open video stage

Notes

Payroll tax (FICA) is not income tax. 2024–2026 still use the 2023 SOI print — the complete report lags two years.

  • Top statutory rate. Highest ordinary-income bracket, regular tax. Not the 3.8% net investment income tax. 28% (1988–90), 31% (1991–92), 39.6% (1993–2000), EGTRRA 39.1%/38.6% (2001–02), 35% (2003–12), 39.6% (2013–17), 37% (2018–26).
  • Effective rate 1989–1998. IRS SOI long-run compilation (1913–2005): total tax liability ÷ total income. Slightly different denominator than AGI.
  • Effective rate 1999–2023. IRS SOI total income tax ÷ adjusted gross income. 1999–2016 Historical Table 1. 2017–2023 Publication 1304 Table 1.2, all returns. 2023 is 14.05%.
  • Who paid. Share of individual returns with total income tax greater than zero. 1989–1998 IRS / Tax Foundation filer series (matches Historical Table 1 on overlap). 1999–2016 Historical Table 1. 2017–2023 Table 1.2. Non-filers are not in the pie. Payroll tax (FICA) is not income tax. 2024–2026 still use the 2023 print.
  • 2024–2026. Top rate is official. Effective rate and the payer pie are still the 2023 SOI print — the complete report lags two years. This is not FICA, corporate tax, or state income tax.

Source: IRS SOI total income tax ÷ AGI · statutory top bracket · effective through tax year 2023