The Record

Debt · Books

Three records. Debt is the pile. Aid is what we send abroad. Books is what came in versus what went out — the gap is the deficit. Separate videos for each. Play from Bush 41 forward.

Debt · 1 of 3

The pile

Brick is gross national debt. Steel is debt held by the public. The gap is intragovernmental holdings — money the government owes its own trust funds. FY2026 is through August 18.

Added since 1989

$37.4T

37,445,088,056,379

Gross debt

$40.0T

40,047,425,768,420

Held by public

$32.3T

32,265,798,542,898

At this year

Donald Trump

FY 2026*

Donald Trump

Gross debtHeld by public
0$10T$20T$30T$40T89939701050913172125

By administration

George H. W. Bush

Bush 41

FY1989–1992

Added
$1.46T
Gross
$4.06T
Public
$3.13T
Bill Clinton

Clinton

FY1993–2000

Added
$1.61T
Gross
$5.67T
Public
$3.41T
George W. Bush

Bush 43

FY2001–2008

Added
$4.35T
Gross
$10.0T
Public
$6.37T
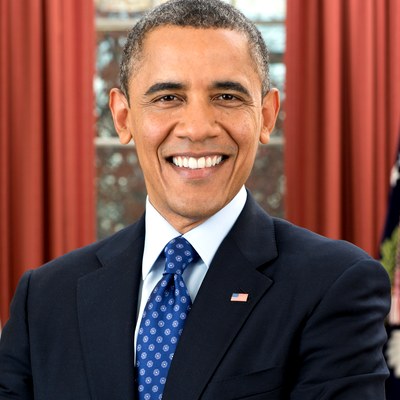
Barack Obama

Obama

FY2009–2016

Added
$9.55T
Gross
$19.6T
Public
$14.4T
Donald Trump

Trump 1

FY2017–2020

Added
$7.37T
Gross
$26.9T
Public
$21.7T
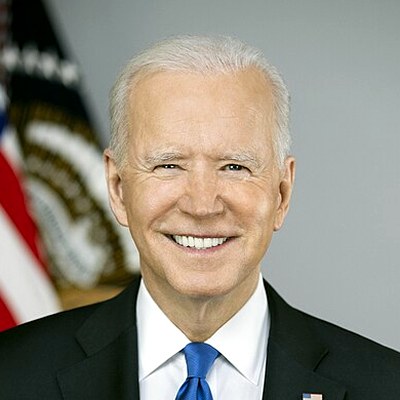
Joe Biden

Biden

FY2021–2024

Added
$8.52T
Gross
$35.5T
Public
$28.3T
Donald Trump

Trump 2

FY2025–2026*

Added
$4.58T
Gross
$40.0T
Public
$32.3T

Post the pile as a video on X

Portrait video for X. Open the stage, press Replay, or download the MP4.

Open video stage

Debt · 2 of 3

Aid

Brick is economic and humanitarian aid. Steel is military aid. Same units — dollars obligated that fiscal year. Complete through FY2024. FY2025–26 are still reporting.

This year

$85.8B

85,779,868,169

Economic

$55.4B

55,397,334,274

Military

$30.4B

30,382,533,895

At this year

Joe Biden

FY 2024

Biden · 1.3% of outlays

Given since 1989 in the years shown: $1.30T · about 1.3% of that year’s federal outlays.

EconomicMilitary
0$20B$40B$60B89939701050913172125

By administration

George H. W. Bush

Bush 41

FY1989–1992

Given
$55.8B
Econ
$39.2B
Mil
$16.5B
Bill Clinton

Clinton

FY1993–2000

Given
$116.9B
Econ
$83.4B
Mil
$33.5B
George W. Bush

Bush 43

FY2001–2008

Given
$245.8B
Econ
$169.8B
Mil
$76.0B
Barack Obama

Obama

FY2009–2016

Given
$373.0B
Econ
$255.5B
Mil
$117.5B
Donald Trump

Trump 1

FY2017–2020

Given
$193.3B
Econ
$140.1B
Mil
$53.2B
Joe Biden

Biden

FY2021–2024

Given
$316.9B
Econ
$220.8B
Mil
$96.1B

Post aid as a video on X

Portrait video for X. Open the stage, press Replay, or download the MP4.

Open video stage

Debt · 3 of 3

The books

Brick is federal outlays — what went out. Steel is receipts — what came in. The fill is the deficit. That gap is why the pile grows. FY2026 is through July.

Outlays

$6.28T

6,284,130,801,213

Receipts

$4.49T

4,485,299,933,037

Deficit

$1.80T

1,798,830,868,176

At this year

Donald Trump

FY 2026*

Donald Trump

OutlaysReceipts
0$2T$4T$6T$8T89939701050913172125

By administration

George H. W. Bush

Bush 41

FY1989–1992

Out
$5.10T
In
$4.17T
Gap
$933.2B
Bill Clinton

Clinton

FY1993–2000

Out
$12.7T
In
$12.4T
Gap
$320.4B
George W. Bush

Bush 43

FY2001–2008

Out
$19.2T
In
$17.2T
Gap
$2.01T
Barack Obama

Obama

FY2009–2016

Out
$28.6T
In
$21.3T
Gap
$7.27T
Donald Trump

Trump 1

FY2017–2020

Out
$19.1T
In
$13.5T
Gap
$5.52T
Joe Biden

Biden

FY2021–2024

Out
$26.0T
In
$18.3T
Gap
$7.65T
Donald Trump

Trump 2

FY2025–2026*

Out
$13.3T
In
$9.72T
Gap
$3.57T

Post the books as a video on X

Portrait video for X. Open the stage, press Replay, or download the MP4.

Open video stage

Notes

End-of-term gross debt minus gross debt at the end of the previous administration (FY1988 for Bush 41). Not adjusted for inflation or GDP.

Aid is obligations, not appropriations. The chart ends at FY2024 — later years are still reporting. Books FY2026 is through July.

  • Gross national debt FY1989–FY2025. U.S. Treasury Historical Debt Outstanding. Total public debt outstanding on September 30 of each fiscal year.
  • FY2026 year-to-date. Treasury Debt to the Penny, August 18, 2026: $40,047,425,768,420.22 outstanding.
  • Debt held by the public. FRED FYGFDPUN (Treasury) through FY2023. Debt to the Penny for FY2024–FY2026. The gap to gross debt is intragovernmental holdings (Social Security and other trust funds).
  • Added by administration. End-of-term gross debt minus gross debt at the end of the previous administration (FY1988 for Bush 41). Not adjusted for inflation or GDP.
  • What counts. ForeignAssistance.gov obligations. Economic is non-military assistance (development, humanitarian, health). Military is assistance to foreign armed forces. Most Foreign Military Sales cash purchases are not in this series.
  • Nominal dollars. USAFacts publishes the series in 2024 dollars. Each year is converted back to that year's dollars with CPI-U so it can sit next to debt and the books. FY2024 is already current dollars.
  • FY2025–FY2026. Reporting lags up to two years. USAFacts shows $46.1B reported so far for FY2025 and $4.3B for FY2026 — incomplete, no economic/military split yet, so the chart ends at FY2024.
  • Share of outlays. That year's aid (economic + military) divided by that year's federal outlays (OMB / FRED FYONET). Foreign aid is about 1% of the budget in most years.
  • Receipts and outlays. OMB Historical Table 1.1, fiscal years, via FRED FYFR (Federal Receipts) and FYONET (Federal Outlays). Millions converted to dollars. Not inflation-adjusted.
  • The fill is the deficit. Outlays minus receipts. A surplus (receipts above outlays) is rare in this window — FY1998–FY2001. Positive gap is borrowing that adds to the debt.
  • Books FY2026 year-to-date. Monthly Treasury Statement, October 2025 through July 2026 (FRED MTSR133FMS and MTSO133FMS). Not a full fiscal year.

Source: U.S. Treasury Historical Debt Outstanding · Debt to the Penny · FY2026 through Aug 18. Source: ForeignAssistance.gov via USAFacts · obligations, economic vs military · nominal dollars (CPI-U) · complete through FY2024. Source: OMB Historical Table 1.1 via FRED FYFR / FYONET · FY2026 year-to-date Monthly Treasury Statement through July.