The Record

Inflation by President

Brick is the average annual rise in the CPI. Steel is how much prices rose over the whole term. Play from Bush 41 forward. The worst year on this chart is 2022 (8.0%).

Average annual

2.8%

38 years shown

Cumulative

180.0%

compounded over years shown

Peak year

8.0%

2022

At this president

Donald Trump

Trump 2

2025–2026

Annual avgTerm total
07.5%15%22.5%30%4.4%19%Bush 412.6%23%Clinton2.8%25%Bush 431.4%11%Obama1.9%7.8%Trump 14.9%21%Biden2.8%5.6%Trump 2
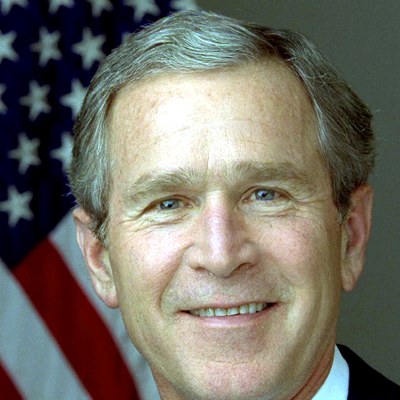
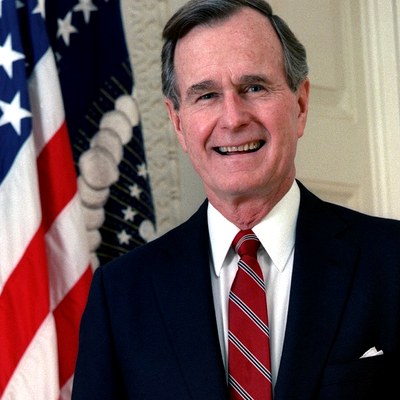
George H. W. Bush

Bush 41

1989–1992

Annual
4.4%
Term
18.7%
Peak yr
1990
Bill Clinton

Clinton

1993–2000

Annual
2.6%
Term
22.7%
Peak yr
2000
George W. Bush

Bush 43

2001–2008

Annual
2.8%
Term
25.0%
Peak yr
2008
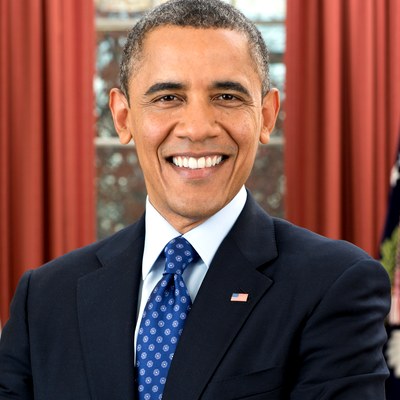
Barack Obama

Obama

2009–2016

Annual
1.4%
Term
11.5%
Peak yr
2011
Donald Trump

Trump 1

2017–2020

Annual
1.9%
Term
7.8%
Peak yr
2018
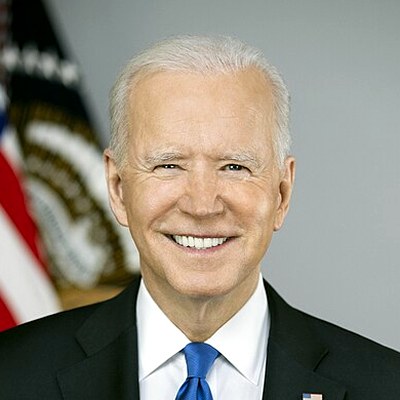
Joe Biden

Biden

2021–2024

Annual
4.9%
Term
21.2%
Peak yr
2022
Donald Trump

Trump 2

2025–2026

Annual
2.8%
Term
5.6%
Peak yr
2026

Post this as a video on X

Portrait video for X. Open the stage, press Replay, or download the MP4.

Open video stage

Notes

Annual is the percent change in the CPI-U annual average versus the prior year. Term is compounded.

  • CPI-U 1989–2026. BLS Consumer Price Index for All Urban Consumers, all items, not seasonally adjusted (FRED CPIAUCNS). Each year is the percent change in the annual average versus the prior year.
  • Cumulative by term. Compound of the assigned years: CPI in the last year of the term divided by CPI in the year before the term, minus one. An eight-year term can look large even when the annual rate is modest.
  • 2025–2026. October 2025 is interpolated as the midpoint of September and November. 2026 is the January–July average versus 2025. July 2026 CPI-U is 333.918.

Source: BLS CPI-U all items · annual average · 2026 through July