The Record

H-1B by President

Red is every approved H-1B petition. Blue is the India-born share. USCIS counts initial and continuing employment — extensions included. Play from Bush 43 forward.

Approved H-1Bs

7.85M

7,846,329

From India

4.96M

4,964,418

India share

63%

63.3% of approvals

At this president
Donald Trump

Trump 2

FY2025–2025 · first year

Total H-1BsFrom India
0625K1.25M1.875M2.5M2.13M986KBush 432.16M1.41MObama1.51M1.10MTrump 11.63M1.19MBiden406K284KTrump 2
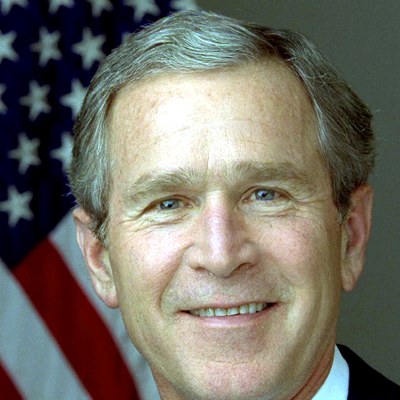
George W. Bush

Bush 43

FY2001–2008

Total
2.13M
India
986K
Share
46%
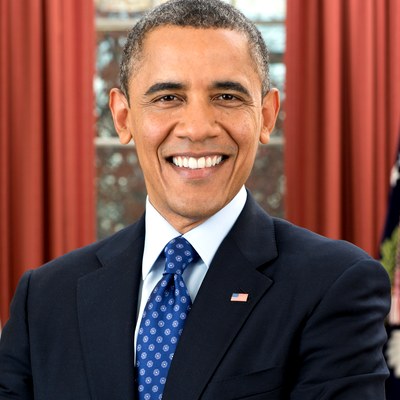
Barack Obama

Obama

FY2009–2016

Total
2.16M
India
1.41M
Share
65%
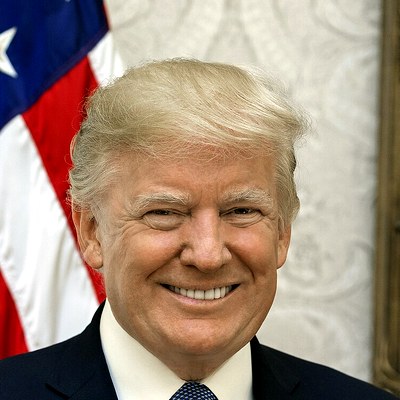
Donald Trump

Trump 1

FY2017–2020

Total
1.51M
India
1.10M
Share
72%
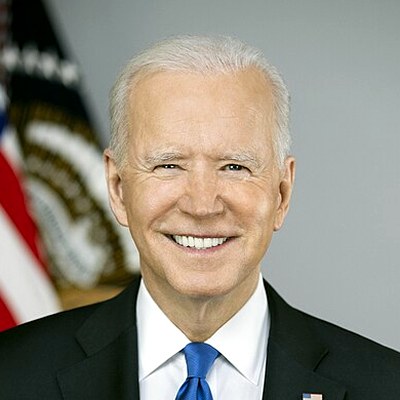
Joe Biden

Biden

FY2021–2024

Total
1.63M
India
1.19M
Share
73%
Donald Trump

Trump 2

FY2025–2025

Total
406K
India
284K
Share
70%

Post this as a video on X

Portrait video for X. Open the stage, press Replay, or download the MP4.

Open video stage

Notes

These are USCIS petition approvals, not visa stamps. A worker already in the country on an H-1B extension is counted. The statutory cap (65,000 + 20,000) applies only to most new employment, so totals far exceed the cap.

India is country of birth. Consistent tables begin FY2001, so the chart starts with Bush 43. Grand total through FY2025: 7,846,329 approvals, 4,964,418 India-born (63%).

  • Approved petitions FY2001–FY2023. USCIS annual Characteristics of H-1B Specialty Occupation Workers reports to Congress. Totals are initial plus continuing employment approvals.
  • FY2024. USCIS FY2024 Characteristics report: 399,395 approvals; 283,397 India-born (71.0%).
  • FY2025. USCIS FY2025 Characteristics report: 406,348 approvals; 284,106 India-born (69.9%).
  • India share in gap years. Where a Characteristics table does not publish an India count, the India share is interpolated between the nearest official years. Those years are marked on the notes.

Source: USCIS Characteristics of H-1B Specialty Occupation Workers · FY2001–FY2025